
Understanding GPU Utilization Metrics

Last week I was having a conversation with a startup using H100s and we started discussing utilization and realized how some of the GPU performance metrics reported by tools may be confusing.
Their dashboards showed 90–100% GPU utilization.
But training was slow. Costs were high. And scaling didn’t help.
Let’s deep dive!
GPU utilization means different things for different people in the stack. It’s one of the most important metrics to know if you are renting or plan to use GPUs.
At first glance, this sounds obvious:
Higher utilization = more work = better efficiency
That assumption is wrong
This metric only means “at least one kernel was running” not that your GPU was doing meaningful compute.
According to the background nvml library used definition is - percentage of time that certain activities occurred during the past sample period.
How is GPU_UTIL is computed (conceptually)
During a sampling interval (say 1 second):
If any kernel is executing → that time counts as “utilized”
If no kernel is executing → counts as idle
Then:
GPU_UTIL = (time ≥1 kernel was active) / (total sampling time)
Example
Kernel runs for 400 ms
GPU idle for 600 ms
DCGM_FI_DEV_GPU_UTIL = 40%
Even if:
Kernel used 1 SM
Or was a tiny memcpy
Or did almost no math
If you only track GPU_UTIL, you can’t see waste.
If you can’t see waste, you can’t optimize.
And if you can’t optimize GPU costs will always surprise you.
Why SM utilization matters:
A GPU has cores and multiprocessing managers. With Nvidia GPUs these multiprocessing managers are referred to as streaming multiprocessors (SMs)
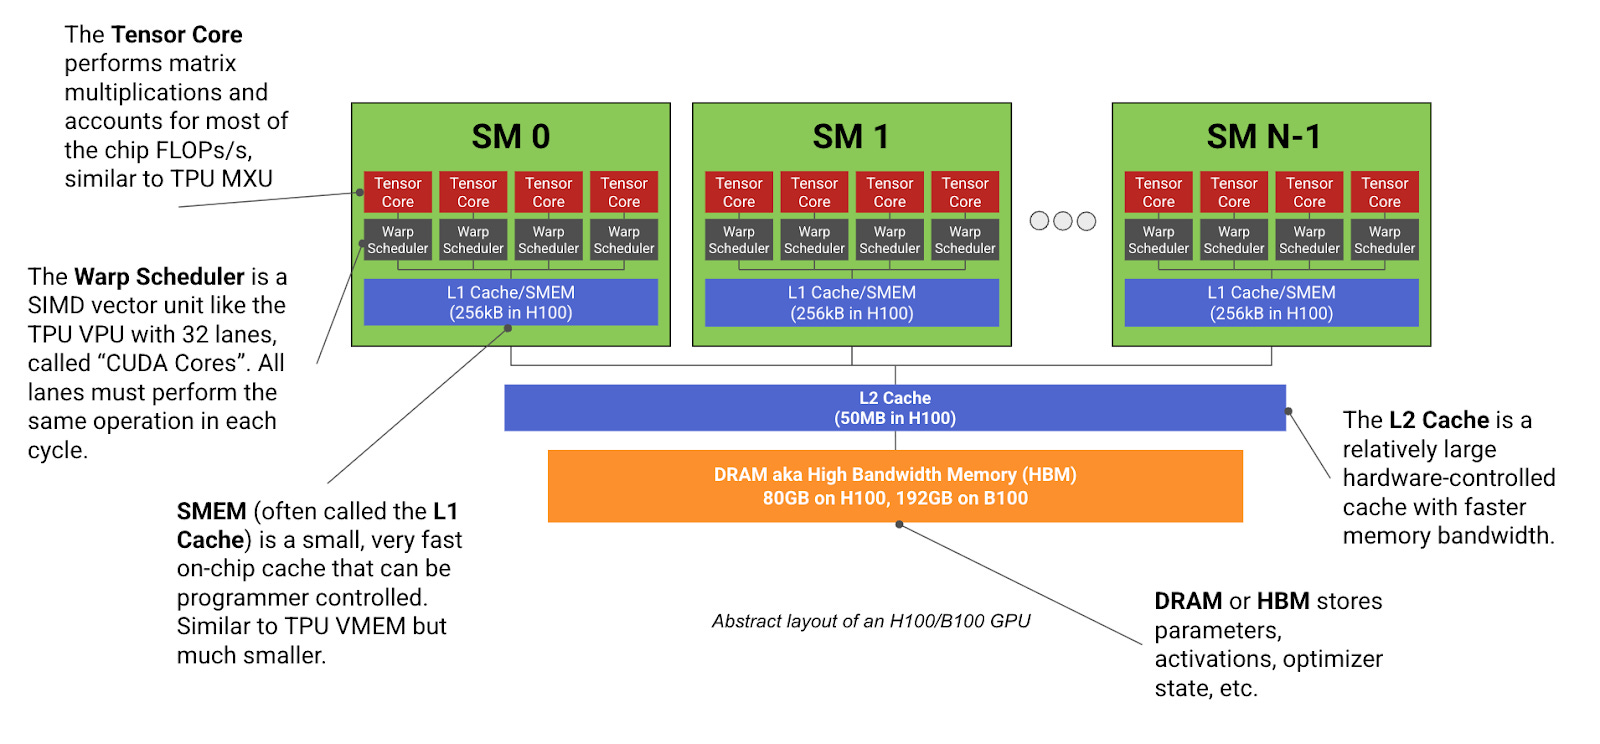
SMs are where tensor math actually runs
CUDA cores
Tensor Cores (FP16 / BF16 / FP8)
If SM utilization is high, the GPU is:
Executing kernels
Running tensor ops
Doing real work
If SM utilization is ~0%, no tensor computation is happening, regardless of memory usage.
If we have a CUDA kernel that continuously runs for 10 seconds but only uses 1 SM, on an H100, this would register 100% utilization, but the SM efficiency would be 1 / 132 = 0.7%.
So its a measure of multi metric:
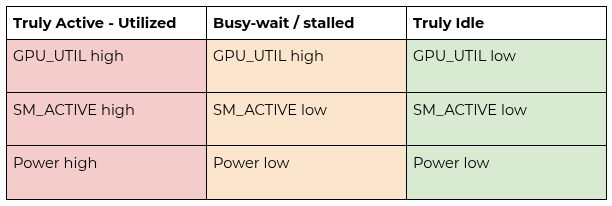
We separate GPU activity from GPU compute. Activity tells us whether any kernel ran; compute tells us whether the GPU was actually doing work. Cost efficiency is measured by compute time over allocated time
GPU Activity
Was any kernel running?
Measured by GPU_UTIL
Binary in nature
GPU Compute
How many SMs were active?
Were tensor cores used?
Was math actually happening?
Cost efficiency = Compute Time / Allocated Time
Most dashboards only show activity.
That’s the core problem.
Here is an 8× H100 system showing ~100% GPU utilization while running a NCCL-heavy workload. Despite the GPUs being fully “busy” in time, SM activity and SM occupancy remain low (~10–20%). This demonstrates why GPU utilization alone is a misleading metric for measuring useful work.
In this workload, the GPUs are continuously executing small NCCL communication kernels, which keeps the device active at all times. However, each kernel launches with limited parallelism and short execution duration, resulting in poor spatial utilization of the SMs. As a result, most of the GPU’s compute capacity remains idle even though GPU utilization reports 100%.
This pattern is characteristic of communication-bound or poorly scaled distributed workloads, where synchronization and collective operations dominate execution time. It highlights the importance of tracking SM occupancy, SM activity, and kernel-level metrics rather than relying solely on aggregate GPU utilization.
The code maximizes temporal utilization (GPU busy time) while minimizing spatial utilization (active warps per SM).
This experiment intentionally constructs a communication-heavy NCCL workload to demonstrate how GPU utilization can be maximized while effective compute utilization remains low. While synthetic, it highlights a real failure mode seen in poorly scaled or synchronization-bound distributed training workloads.
import os
import time
import torch
import torch.distributed as dist

def main():
    dist.init_process_group("nccl")

    rank = dist.get_rank()
    world_size = dist.get_world_size()
    local_rank = int(os.environ["LOCAL_RANK"])

    torch.cuda.set_device(local_rank)
    device = torch.device("cuda")

    # Small tensor → low occupancy
    num_elems = 256 * 1024   # ~1MB FP32
    x = torch.ones(num_elems, device=device)

    # Warm-up
    for _ in range(20):
        dist.all_reduce(x)
    torch.cuda.synchronize()

    iters_per_loop = 100   # critical knob

    start = time.time()
    duration_sec = 1800    # 30 minutes

    loops = 0
    while time.time() - start < duration_sec:
        for _ in range(iters_per_loop):
            dist.all_reduce(x)
        loops += 1

        if rank == 0 and loops % 100 == 0:
            print(f"Running... {loops} loops")

    dist.destroy_process_group()

if __name__ == "__main__":
    main()